Issue #12 
March 25, 2007 | Newsletter
The newsletter with chart analysis for stocks and stock indexes |
Friday March 23, 2007 - Daily Closing Update |
|
Market Humor |
Stock Indexes Update |
Stock Picks for Next Week | |
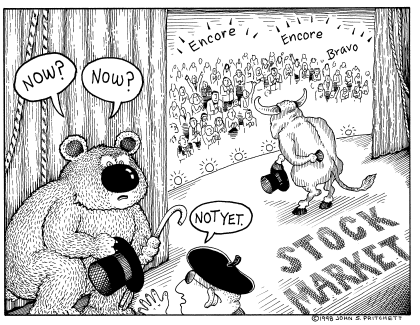
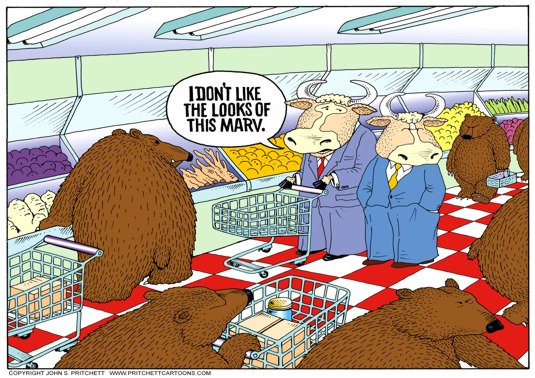
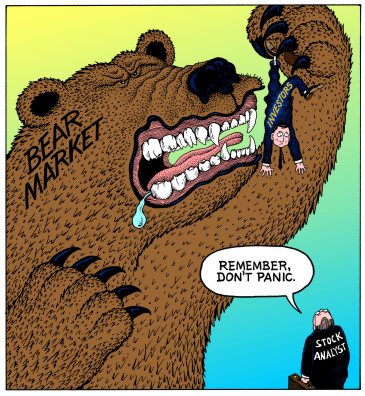
| Timely Stock Market Humor?
1) MOT - Covered short at 18.53 for a profit of $64 (commission included).
2) MOT - Shorted MOT at 17.87 with stop at 18.31
2) TRAD - Holding long position initiated at 11.69 now with stop loss order raised to 12.51. Objective is 13.30. Stock closed Friday at 12.50.
3) MMC - Short at an average price of 28.84. Original stop loss order rescinded. Stop loss order now at 30.37. Stock closed Friday at 29.91
4) RMBS - Short covered at 21.13 after bullish report. Loss on the trade of $176 (commissions included).
5) ANGO - Holding long positions with an average entry price of 23.81. Stock closed Friday at 22.01.
6) RADN - Holding short position shorted at 9.63. Stop loss order now at 9.59. Stock closed Friday at 9.28.
7) FTEK - Shorted at an average price of 26.755. Stop loss order now at 27.29. Stock closed Friday at 26.07.
View Feb 26, 2007 Newsletter View Mar 04, 2007 Newsletter View Mar 11, 2007 Newsletter View Mar 18, 2007 Newsletter |
Chart Analysis Indexes - Week of Decision?
DOW Friday close at 12483
The DOW, this year, seems to be mirroring the chart of 2004 in many ways. In 2004 the DOW had the first correction of 750 points which started in the 4th week of February. That correction followed a rally of over 1600 points in the previous 8 months. This year the first correction started in the 4th week of February as well and had a first correction of 850 points. In 2004, after the first low point was found, the DOW rallied 570 over a period of three weeks and then found its second correction top and proceeded to fall 720 points and make a new correction low. Next week will be the third week, after the first correction low was made, and the DOW has rallied 570 from that low.
If the DOW continues to follow the pattern of 2004 that means that the second correction top will be made this coming week.
In looking at the weekly charts the DOW shows very strong weekly closing resistance at 12487 and also shows very strong intra-week resistance between 12552 and 12582. In following the pattern that would mean that the DOW could rally some 70-80 points from Friday's high of 12510 but by the end of the week would close lower that this week's close (12483).
The second corrective low in 2004 took 6 weeks to form. If that holds true this year, we would likely see the DOW fall beneath the 11939 level (seen two weeks ago) sometime in the second week of May.
If this scenario continues it will likely mean some backing and filling over the next few weeks with a possible trading range between 12345-12353 and 12552-12582. On the way down, the following support levels could come into play. The 12487 level will likely be a pivot point in the DOW over the next few weeks and 12398 and 12353 should act as support and 12582 as resistance.
Below 12353 there is a minor support at 12243-12267 but should that level of support break the DOW would likely fall back to the 12039-12089 area which can be considered important support.
This week, the probabilities favor a choppy market trading between the ranges I outlined above. If I am wrong it is likely to favor a break of supports rather than a rally above the resistance levels mentioned.
NASDAQ Friday Close at 2448
The NASDAQ was able to confirm a close above the 50 day MA on Friday but did close just below an important weekly close at 2450. The NASDAQ is also at a very important level as it is just below the gap that it left on the way down between 2470 and 2492. Closure of that gap would be positive. In addition the 2470 level also represents two major weekly highs made prior to the run up to the 2531 4-year high. Any excursions above 2470 and into the gap area will be viewed as extremely positive.
On the other side of the coin, failure to penetrate through that level will generate disappointment and profit taking of the longs.
Many analysts have predicted that the Stock Market is in a corrective phase and that more downward movement will be seen. The charts certainly seem to show that the indexes are now at major pivotal levels and therefore should be treated accordingly.
The NASDAQ shows some support at 2444, then at 2431-2433, and major at 2418 and also at 2390-2401. Should that support level break there is nothing of consequence until the 2340 level is reached.
Due to the fact that the NASDAQ has closer and more clearly defined levels of support and resistance it should be used as the main indicator for the stock market during the next few weeks.
The 2004 chart in the NASDAQ cannot be used as a mirror image as the high for the NASDAQ was seen in the 4th week of January (not the 4th week of February). In addition in 2004 the NASDAQ seemed to be the "weak sister" of the indexes and lead all the indexes down. Nonetheless it is important to note that in 2004 the NASDAQ fell a total of 345 points from its high, over a period of 7 months. If that measuring stick is used this year it would mean the NASDAQ could have an objective of 2200.
As in the DOW the NASDAQ is likely to maintain itself, on a weekly closing basis, below this weeks' close of 2448. Rallies should be met with stiff resistance and, if this is only the first leg of the correction it will mean that the corrective high will be seen this week.
S&Poors 500 Friday close at 1436
In several ways the SPX has been acting as the "strong sister" during this correction. It has been able to close substantially above the 50 day MA on three straight day whereas the DOW just barely closed above it on Friday. Nonetheless the 1438-1440 level in the SPX is very important not only on a weekly closing basis but on a daily basis as well. A close above 1440 on a daily basis could generate a move up to 1452 and within a few points of its 4-year high at 1461. One of the reasons for the strength is the fact that the SPX does not have a gap to close (as with the other two indexes) and therefore the resistance on this chart is of less strength.
It will be interesting to see if the SPX is able to rally above the 1440 level if the DOW is able to rally at the beginning of the week. It could be a telling index and/or detail to watch.
Strong resistance at 1440-1438 and then at 1452. Support at 1431-1433 and then very strong at 1420. Major support at 1409, and if broken nothing of consequence until 1373-1377.
This following week is likely to be a relatively slow week with generally narrow trading ranges and difficult movement to the upside. All indexes will likely stage some form of rally in the early part of the week and show some weakness toward the latter part of the week. Closes next Friday should be lower than this past Friday if the 2004 chart is to be imitated.
Nonetheless, one must be aware at all times that the indexes are in a corrective phase and that the economy has been receiving a negative fundamental news in general. Many analysts are still expecting an additional 5 to 10% correction to come. That means that shorting rallies is still the preferred place to be.
|
Stocks CHART Outlooks
With the indexes likely to be close to their second top in their corrective phase this week should be one of taking profits on long positions and shorting stocks that have weak charts.
NDAQ (Friday Close at 29.25)
NDAQ has been a stock under a lot of pressure ever since its failed buy-out/take-over attempt of the London Stock Exchange. Way before the indexes began their correction NDAQ had already given up over 20% in price value.
NDAQ has a major daily and weekly low at 30.79 which should act as a strong resistance level. In addition the $30 level should act as a strong psychological level as all even prices ($10, $20, $30, etc) usually become support/resistance depending on which side the stock is trading at.
NDAQ was able to stage a rally this past week to the 30.40 level but failed to maintain itself above $30 at any time and on Friday closed below a minor weekly support level at 29.31. There is strong intra-day resistance at 30.50-30.55 as well as the major closing resistance at 30.79. There is some support at 28.90 but it is considered minor and below that there is nothing until 27.40.
The weekly charts seem to point out that a trading range between $25 and $30 is highly likely with 23.91 being an outside possibility on the downside and 31.29 and outside possibility on the upside.
In looking at the stock index charts it is possible that if they rally at the beginning of the week (up to their respective resistance levels outlined in this newsletter) that NDAQ could also attempt one more rally above $30. On such a rally a short position could be instituted with a stop-loss placed at 30.89. Objective on the trade would be a test of the $25 level. The trade offers a 5-1 risk/reward ratio.
My rating on the trade is a 7.5 (on a scale of 1-10 with the strongest probability rating being 10).
MOT (Friday close at 17.75)
MOT, as a short, is a high probability trade with a well-defined risk factor and high probability of success.
MOT last week had a disastrous earnings report where the average expectation was for $.20 cent earnings being shown and yet the report showed a negative -$.09 cents. In addition the CFO resigned and the CEO is in hot water. Motorola has not been competitive with the Japanese counterparts and has been losing market share because of it.
In using the charts MOT shows a gap down opening and a break of the major 2-year support level at 17.90 happening the day after the report came out. After breaking down to 17.45, a re-test of the 17.90 level came on Friday but the stock was unable to trade above it. Due to the negative nature of the report, the negative outlook for the immediate future, and the major break of support MOT looks like a stock that wants to continue to go lower.
You have to go to the weekly charts to find support levels in MOT and there is nothing of consequence until the first support level at 16.34 is found. That level, though evident, is not considered a major level of support. You have to go down to the 15.60-16.20 price to find a support level that will likely hold the market up, at least for a short period of time. It isn't until the $14.20-14.75 level is seen that major support comes in.
The nice thing about this trade is that the risk factor is not only small but clearly evident. The 17.90-18.05 level should be as strong a resistance as can ever be found and due to the strongly negative earnings report and changes to management the gap area up to 18.31 should not be filled. Short positions instituted on rallies up to 17.90 using a stop-loss order at 18.31 (closure of the gap) can be used. Using a minimum objective of 16.34 the trade offers a 4-1 risk/reward ratio.
My rating on the trade is an 8 (on a scale of 1-10 with the strongest probability rating being 10).
JDSU (Friday close 15.47)
JDSU has been in a very evident downtrend since March of last year when it saw a high of 34.40. In November of last year JDSU had a short covering rally that took the stock from a low of 13.94 to a high of 19.66. In spite of that nice rally JDSU was unable to go above the previous high of 21.52 and has given up most of that rally.
Every subsequent rally failed to clear above a previous rally and recently it broke below a very important closing support between 15.62-15.79 and started to get into the gap that started the rally at 14.40-15.70. For the last 3 weeks JDSU has traded between 14.85 and 15.64 building on the weekly charts a probable inverted flag formation which, if broken, would give an objective of 12.50 and a re-test of the $11-$12 area of major support.
During the last 3 weeks JDSU has also been unable to close above the major support it broke between 15.62- and 15.79 though it has now tried on several occasions. The possibility of the indexes coming under pressure makes the JDSU chart come to life with the probability of the gap down at 14.40 being filled, the support at 13.94 being tested, and a stab at testing the 4-year closing low at 11.04 come into view.
A sale of JDSU at Friday's closing price of 15.47, placing a stop loss order at 15.85. and a short term objective of 13.94 would offer a risk/reward ratio of 4-1. If the 13.94 level gets broken and a drop to the $12 comes into play the risk/reward ratio would climb up to a high of 6-1.
My rating on the trade is a 7.5 (on a scale of 1-10 with the strongest probability rating being 10).
JNPR (Friday closing price 18.95)
JNPR is a stock that may or may not be bottoming out but either way offers a short-term profit potential on the short side. JNPR has been in a very well-defined down trend since December 1st of last year with consistent peaks and valleys along the way. Most recently it rallied from a low of 17.21 to Friday's high at 19.68 but on Friday it had a classic reversal day with higher highs, lower lows and a close below the previous day's low. The high came at a level that is commensurate with a clearly defined downtrend line.
Using the weekly chart JNPR seems to have found a strong bottom at 12.10 after a 3 year drop from 31.25 but that low has yet to be tested either.
Even if JNPR is trying to bottom out (not yet established) it is evident that the 17.21 low must be tested at least once before trying to establish a new attempt up to break the downtrend. If the 16.98-17.21 level does not hold on the re-test it is probable that JNPR could drop to the next support level at 14.83
Rallies between 19.24-19.46 can be sold using a stop loss order at 19.76 and looking at a minimum break down to 17.84, with the possibility of more.
Risk/reward ratio on this trade is at least 3-1 with good possibilities of more. If the 16.98-17.21 level of support breaks (due to a new low in the indexes) the risk/reward ratio, using 14.83 as an objective, would climb to as much as 9-1.
The reversal on Friday as well as the high reached make that high a level a trader can sell off of. Therefore the 19.76 stop loss can be considered well-placed.
My rating on the trade is a 6.5 (on a scale of 1-10 with the strongest probability rating being 10).
|
The opinions and commentaries by Mr. De Vito are not a recommendation to buy or sell, but rather
a charting guideline, based on his own knowledge and experience, regarding the stocks he is following or
that are brought to him by others. Mr. De Vito does not presently offer a track record of his trading experiences.
No inference of success and/or failure should be assumed. The
information enclosed above, regarding his background, length of trading, and experience, is correct
but is not meant to suggest, state, or infer any future success in trading, based on his opinions. The information herewith included should only be used by investors who are aware of the risk inherent in securities trading. Mr. De Vito accepts no liability whatsoever for any loss arising from any use of the information and/or comments he supplies. |
 |
|
|


