Issue #498 
Oct, 9 2016 | Newsletter
The newsletter with chart analysis for stocks and stock indexes |
Stock Indexes Analysis/Evaluation
|
| Yo-Yo Action Continues. Seasonal Correction Fades!
DOW Friday closing price - 18308
The yo-yo type trading in the DOW continued, adding 5 more trading days (total of 21 now) to the sideways trading range between 17992 and 18449 that has been going on since September 9th. Nonetheless, the scale has slightly tipped to the bear side since now (as of Friday) there have been 9 green daily closes and 12 red daily closes instead of the 8 and 8 seen the previous week.
The DOW is likely to be a "follower" and not a "leader" this week given that the earnings quarter begins on Tuesday and the first reports of any consequence will be in the financial industry on Friday. As such, the probabilities favor more of the same until then, especially given that the index had an inside week and a close just a few points above the mid-point of the week's trading range.
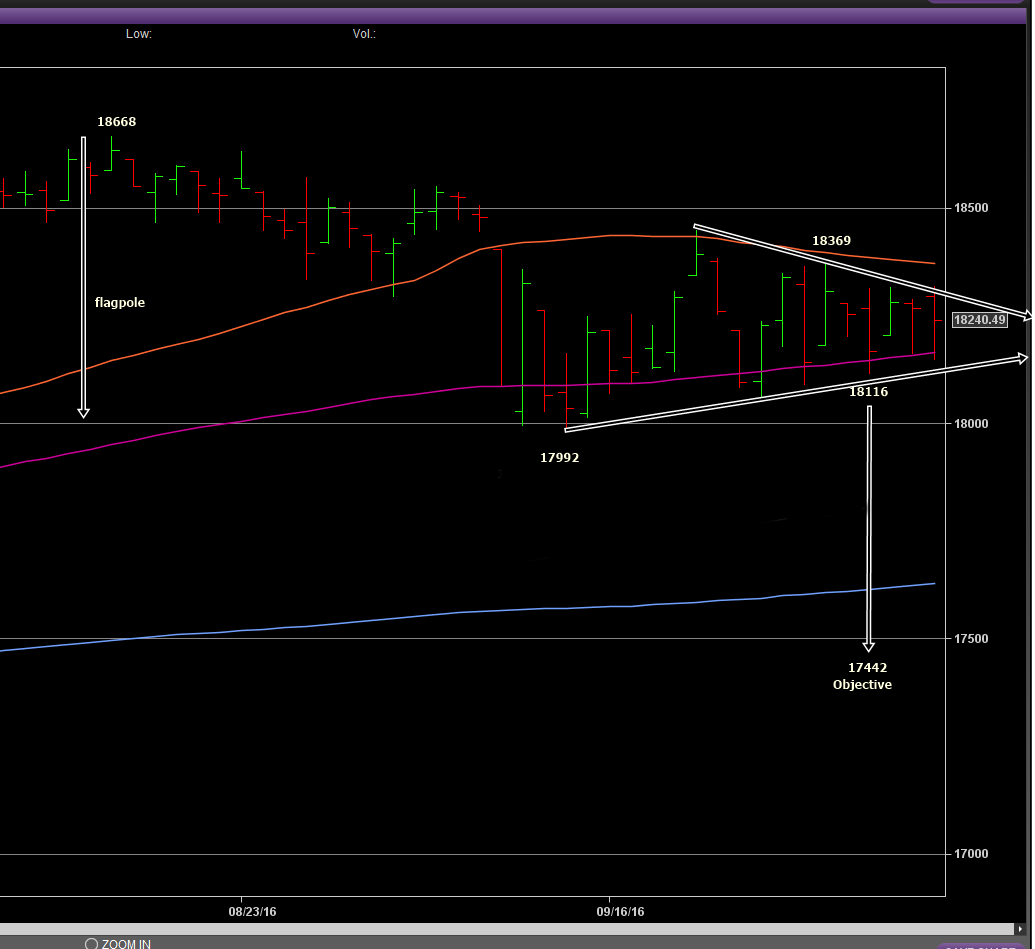
By the same token, the index does have a very evident coil formation that favors the bears given that the index is presently in a short-term downtrend, having dropped from 18668 to 17992 in the 3 weeks prior to the coil formation starting. The coil formation presently has a breakdown point at 18116 that offers a 17442 objective. A rally above 18369 would void the coil (see chart below).
The only thing the DOW (and the other indexes) are fundamentally facing now is the earnings quarter that starts on Tuesday with AA reporting. Based on Tradingeconomics.com, the DOW is expected to head lower:
Forecast Actual Q4/16 Q1/17 Q2/17 Q3/17 2020 Unit
Dow Jones Industrial Average Forecasts are projected using an autoregressive integrated moving average (ARIMA) model calibrated using our analysts expectations. We model the past behaviour of Dow Jones Industrial Average using vast amounts of historical data and we adjust the coefficients of the econometric model by taking into account our analysts assessments and future expectations. The forecast for - Dow Jones Industrial Average - was last predicted on Saturday, October 8, 2016.
In general, forecasts in the DOW for the 3rd quarter are expected to be lower, which means that the leaning-to-the-downside charts do reflect what the traders are thinking.
Probabilities favor the bears in the DOW.
SPX Friday closing price - 2168
The SPX generated an inside week for the second week in a row, meaning that once again nothing was decided or cleared up this past week. Nonetheless, on Friday the index spanned the entire trading range for the week, having gone up to 2165 and down to 2144, which were the previous high and low for the week and closed in the lower half of the day's/week's trading range, suggesting that further downside below 2144 will be seen next week and probably on Monday.
The SPX also has produced a coil formation (like the DOW) that is tilted toward the downside and will offer a 2070 objective if the 2144 low is broken. On a daily closing basis, the coil is presently in a 10 point trading range between 2150 and 2160, suggesting that sometime this week that coil will be broken.
One additional negative is that the SPX is in a 7-week downtrend with 3 successful retests of the double top at 2093 that was built using the highs seen on August 15 and August 23. As such, the chart formation now strongly favors the bears, meaning that the bulls need to come up with a fundamental reason to break the now bearish leaning chart.
The SPX will be the first index to receive earnings reports, with C, WFC, and JPM reporting on Friday. Nonetheless, it is being said by Factset.com that the outlook for earnings this quarter is down:
Earnings Growth:
Based on the chart of the SPX, the probabilities favor the bears.
NASDAQ Friday closing price - 5292
The NASDAQ generated a mini reversal week, having gone above the previous week's high and then closing in the red. What makes this mini reversal possibly indicative is that the rally above the previous week's high did not break the all-time high at 5341 and the red close was in the lower half of the week's trading range, suggesting a higher probability of the index going below last week's low at 5266 than above last week's high at 5330. If that scenario occurs this week, a successful retest of the all-time high will have occurred.
One additional negative is that the NASDAQ generated the negative reversal in spite of AMZN and PCLN making new all-time intra-week and weekly closing highs. Both of those stocks are showing overbought conditions with PCLN showing "record" high RSI and Slow Stochastic numbers. It is interesting to note that both stocks sold off on Thursday and Friday to close in the middle of the week's trading ranges and that is the first time it has happened to either stock in the last 4 weeks, which in turn suggests that the bulls may be finding selling interest.
The NASDAQ chart continues to be the most positive of the 3 main indexes as the index is only .9% (based on Friday's close) below the all-time intra-week high but like the other two indexes, it too has built a short-term negative formation on the daily chart that if broken to the downside (a daily close below 5283) would offer a 5200 objective. With no important earnings reports due out this week, the index will likely follow what the SPX does, especially considering that the main stocks of the indexes are not likely to have the kind of up weeks that they have had recently.
Probabilities slightly favor the bears in the NASDAQ.
The bulls this year have managed to prevent the seasonal July-August correction and probably also the September-October correction, given that the earnings quarter starts this week and generally the first 3 weeks of the earnings quarter are supported. By the same token, earnings are expected to be down this quarter and if that is proven to be the case, the unexpected failure of the seasonal corrections could turn out to be a negative sign for the market.
This is also an election year and though over the past 6 elections (spanning 24 years) there has not been a candidate that has "moved the needle" in a big way, this election could be different if Trump gains any more strength. By the same token, this is already a year of change, inasmuch as the Fed raised interest rates this year for the first time in 9 years and is expected to raise them again before the end of the year. Such an outlook promises to generate some reaction in the market (probably a negative one), meaning that by November 8th, "all bets are off".
There are no economic reports of consequence due out this week and no earnings reports of consequence due out before Friday, meaning that much of the trading this week will be technical. The chart outlook for the near future leans slightly to the bear side and it would not be surprising if the indexes trigger the clearly defined chart supports given that the expectations for this earnings quarter are low.
|
Stock Analysis/Evaluation
|
CHART Outlooks
There are no mentions in the newsletter this week because the yo-yo type action continues, meaning no trend has been determined. In addition, the earnings quarter starts this week and normally the indexes are supported during the first 3 weeks of each quarter. By the same token, with so much of the seasonal tendencies having "gone down the drain" this year, purchases are not recommended either as the market is running a bit askew.
|
Updates
|
| Updates on Held Stocks |
Closed Trades, Open Positions and Stop Loss Changes |
| ADSK generated a negative reversal week, having made a new all-time high and then closing in the red. The stock closed in the lower half of the week's trading range, suggesting further downside below last week's low at 70.85 will be seen this week. Intra-week support is found at 70.85 and 70.58 and then nothing until minor support is found at 66.76. Important and pivotal support is found at 65.06. Pivotal resistance is now found at 73.40. A hard stop loss should now be placed at 73.50 because if the stock makes new highs, there is nothing to stop it from heading higher. The 70.50-70.58 level seems will be indicative support this week. It is likely to be seen but if the bears are not able to break it, buying interest will return. By the same token, a break of that level is likely to take the stock down to at least 68.87 if not all the way down to the 67.00 level. Probabilities slightly favor the bears this week. ARNA continued to inch higher with the 2.05 level as the main objective for this week. The stock closed on the highs of the week and further upside above last week's high at 1.90 is expected to be seen. Support is now decent as well as pivotal between 1.67 and 1.70. Probabilities favor the bulls this week. CLB followed through on the previous week's spike rally and close on the highs of the week with an additional .8% rally (about $1). The stock once again closed near the highs of the week and further upside above last week's high at 114.33 is expected to be seen. The stock is trading at an important and pivotal level as the 100-day MA is currently at 113.30 and that is where the stock closed on Friday. In addition, the 50 and 100 week MA's are also all in that area, adding strength to the resistance, at least on a daily and weekly closing basis. Intra-week there is resistance between 114.29 and 114.33 and then nothing of consequence until the 117.00 is reached. The chart suggests that further upside will occur but it is likely dependent on what oil does and oil also closed at an important resistance area at 49.63. Minor intra-week support is found at 111.63, a bit stronger and short-term pivotal at 110.35 and then nothing until the 107.52/107.96 level is reached. COF extended its uptrend, having generated the 3rd weekly green close in a row and the 12th out of the last 15, generating a 28% rally from the 58.02 low seen in June. The 28% rally means that the 15-month downtrend is over and now the question is whether the stock has started an uptrend or whether a sideways trend is what will now ensue with the main objective being a drop back down to the $67 level. The entire area between 72.87 and 73.83, all based on weekly closes, has proven to be pivotal resistance for the past 30 months. This week is pivotal, given that a red close will make last week's close at 73.05 into a successful retest of the 200-week MA, currently at 72.65, while a green close above 73.83 will generate a buy signal. The stock did close in the upper half of the week's trading range, suggesting further upside above last week's high at 74.07 will be seen this week. Intra-week resistance of some consequence is found at 74.35, meaning that if that level is broken, the bulls will get a strong edge. A hard stop loss at 74.45 should be placed. ENG generated a successful retest of the weekly close breakout area, having closed in the green on Friday, making last week's close at 1.51 into a successful retest of the previous high weekly close at 1.50. The stock closed on the highs of the week and further upside above last week's high at 1.59 is expected to be seen. With the successful retest of the breakout area, the bulls should target and break the recent 1.73 high (within the next couple of weeks) with the objective of reaching the stronger intra-week resistance at 1.88. Intra-week support is now found at 1.49 and pivotal at 1.44. Monthly chart suggests a 2.92 to as much as 3.80 objective to be reached within 6-12 months. FCEL generated a negative reversal week, having made a new 3-month intra-week high and then closing in the red and on the lows of the week, suggesting further downside below last week's low at 5.21 will be seen this week. Short-term pivotal support is found at 5.20 that if broken would suggest that the 4.98-5.02 level of decent support will be re-visited. Intra-week resistance is found at 5.60 and at 5.67. Chart suggests the stock is in the process of building a strong rounded bottom formation but that it is likely that another 3 months of base building will occur. The 5.20 level is short term pivotal but not likely to be longer term indicative. Chart suggests the stock will trade between the $5 level of support and up to the 200-week MA, currently at 5.80, for the rest of the year. FSLR bulls were unable to follow through to the upside this past week in spite of the strong spike up rally and close on the highs of the week the previous week. It is evident the resistance at the $40 demilitarized zone and up to 40.72 remains strong enough to hold the rallies down. The stock closed on the lows of the week and further downside below last week's low at 37.23 is expected to be seen this week. Decent and likely to hold support is found between 36.72 and 36.83 that is likely to be seen this week. It is likely that the stock is in the process of building a new support base given that the previous one at 35.45 (36.72 on a weekly closing basis) was recently broken. By the same token, the fact the stock 2 weeks ago broke above a meaningful intra-week resistance at 39.31 suggests the downtrend has ended. I expect to see a positive reversal week, with the stock getting down to 36.72 and turning around to close in the green next Friday, possibly with a 49.31 objective for the week. GOOGL confirmed that the breakout/new all-time high seen 3 weeks ago has failed, having generated a 2nd red weekly close in a row below the previous all-time high at 807.05. The stock closed in the lower half of the week's trading range, suggesting further downside below last week's low at 796.23 will be seen this week. Minor intra-week support is found at 796.23, a bit stronger between 786.83 and 787.33 and pivotal at 783.50. Below that, there is no intra-week support until 770.00 is reached but on a weekly closing basis, pivotal support is found at 780.00. Resistance is found at 810.89 and at 813.33. Chart looks slightly bearish with a possible and perhaps even likely downside objective of $787 for this week. With the put option expiring in 2 weeks, a drop down to that level this week could be used to consider taking the small profit that would likely be offered. GS has rallied 7.2% over the past 6 trading days after the stock got down to the 200-day MA, currently at 158.65, and generated a successful retest of that line. The stock got above a recent intra-week resistance level of some consequence at 169.35 and did close on the highs of the week, suggesting further upside above last week's high at 169.98 will be seen this week. Nonetheless, this rally is pivotal, given that the recent 10-month high at 172.40, represents an important weekly close resistance area and as such, this rally is likely to determine whether an uptrend has begun and much higher prices will be seen, or whether this rally is the last rally and a short-term downtrend will be seen with the first objective being another retest of the 200-day MA. Intra-week resistance will be found at the top of the 170.00 demilitarized zone (at 170.30). Stock reports earnings on Tuesday October 18th and as such, probabilities favor the stock likely trading between 164.51 and 170.24 this week. HON fell 6% in value due to lowered sales projections from the company that were released on Friday. The stock broke all support levels built over the past 7 months and closed at the previous all-time high weekly close from May 2015 at 106.84 (stock closed on Friday at 106.95. The stock did close near the lows of the week and further downside below last week's low at 105.25 is expected to be seen. Nonetheless, what will be important this coming week is whether the stock closes in the red or in the green next Friday, as a red close will give a failure signal and a green close will generate a rally over the next couple of weeks, back up to 111.65 which is where the 200-day MA is currently located. As far as the downside for this week is concerned, there is decent support at 101.28, which if seen should be considered as a good place to take profits. KGC fell strongly this week, having broken convincingly both the 200-day and 200-week MA's (currently at 3.97 and 4.15 respectively) and closing on the lows of the week, suggesting further downside below last week's low at 3.42 will be seen this week. One possible redeeming factor is that the stock closed at 3.52 which is only 5 points below the important high weekly close at 3.57 that when broken to the upside in April caused the stock to rally up to the 5.82 level. If the bulls can generate a green weekly close next Friday, it will be a positive sign that no further downside will be seen. Nonetheless, at this moment the break that occurred is a strong negative that could cause the stock to go back into a downtrend. Decent but old (from 1993) support is found at 3.37 and then nothing until minor support is found between 2.68 and 2.98. If 3.37 is broken, the probabilities favor the stock getting down to at least 3.00. Resistance is not found until the 200-day MA at 3.97 is reached. Probabilities favor the bears. MT had a positive week with a green weekly close and near the highs of the week, suggesting further upside above last week's high at 6.43 will be seen this week. Resistance is decent at 6.59 and at 6.94. Support is decent and pivotal at 5.38. The stock did make a new 29-trading day high last week that gives the edge back to the bulls, suggesting that a retest of the 6.59 high is the most likely scenario. Because of getting the edge back, the 6.00 level is once again considered short-term pivotal support. With the stock closing on Friday at 6.29, it is almost a toss-up as to whether 6.59 or 6.00 is seen first. Probabilities slightly favor the bulls. SINA generated a new 4-week high this past week on good factory data from China but the bulls failed to hold on to the gains and the stock fell back to close on the lows of the week, suggesting further downside below last week's lows at 74.08 will be seen this week. The bulls failed to close the gap up at 80.60 (high this past week was 80.42) and that has to be considered a negative of consequence. Intra-week support is found at 73.61, at 72.76, and at 72.42 that is a level that if broken would likely be catalytic for the short term. Below 72.42 there is very minor support at 69.29 and then nothing until 62.85 is reached. Resistance is found at 78.22, at 79.30 and at 80.43. Probabilities favor the bears. A drop below last week's low at 74.07 will make last week's high at 80.42 into a successful retest of the 33-month high at 85.42 and weaken the chart considerably, suggesting that the support at 62.85 will be targeted. Probabilities favor the bears.
|
1) FCEL - Averaged long at 2.2275 (4 mentions). No stop loss at present. Stock closed on Friday at .435 (new price 5.22). 2) FCEL - Purchased at 5.27. Stop loss now at 4.65. Stock closed on Friday at 5.22. 3) ENG - Averaged long at 1.92 (3 mentions). No stop loss at present. Stock closed on Friday at 1.59. 4) EBAY - Liquidated at 31.80. Averaged long at 31.66. Profit on the trade of $28 per 100 shares (2 mentions) minus commissions. 5) ARNA - Averaged long at 3.725 (4 mentions). No stop loss at present. Stock closed on Friday at 1.86. 6) MT - Averaged long at 5.57 (3 mentions). Stop loss now at 5.23. Stock closed on Friday at 6.29. 7) FSLR - Averaged long at 44.87 (4 mentions). Stop loss now at 33.64. Stock closed on Friday at 37.58. 8) CLB - Shorted at 112.19. Stop loss at 114.39. Stock closed on Friday at 113.34. 9) GS - Shorted at 164.07 and at 169.69. Averaged short at 167.61 (2 mentions). No stop loss at present. Stock closed on Friday at 169.83. 10) HON - Averaged short at 117.09. No stop loss at present. Stock closed on Friday at 106.94. 11) COF - Shorted at 72.36. Averaged short at 71.656 (3 mentions). Stop loss at 74.35. Stock closed on Friday at 73.05. 12) SINA - Averaged short at 76.855. No stop loss at present. Stock closed on Friday at 74.73. 13) GOOGL - Purchased 800 October 21st Put option at $10.50. Option closed at 8.50 on Friday. 14) ADSK - Averaged short at 70.96 (2 mentions). No stop loss at this time. Stock closed on Friday at 72.01.
Previous Newsletters
|
Encyclopedia of Chart Patterns. A must have for chart aficionados! |

The opinions and commentaries by Mr. De Vito are not a recommendation to buy or sell, but rather
a charting guideline, based on his own knowledge and experience, regarding the stocks he is following or
that are brought to him by others. Mr. De Vito does not presently offer a track record of his trading experiences.
No inference of success and/or failure should be assumed. The
information enclosed above, regarding his background, length of trading, and experience, is correct
but is not meant to suggest, state, or infer any future success in trading, based on his opinions. The information herewith included should only be used by investors who are aware of the risk inherent in securities trading. Mr. De Vito accepts no liability whatsoever for any loss arising from any use of the information and/or comments he supplies. |
|
|
|